Keith Richardson
MAT-200-U1
Two Population Inference Project
Step 1 – the Guiding Question
Final Fantasy Brave Exvius: War of the Visions is a mobile tactical RPG based in the Final Fantasy Brave Exvius Universe. The game uses the combat system that became popular in 1997 in the game Final Fantasy Tactics on the Playstation gaming system. Through talking to many of the players, popularity of the game to be tied to nostalgia of the original games. The game has a player rank, which is tied to how much of the game they have completed, how many characters they have leveled up, as well as how much in game currency they have spent, and purchased.
The guiding question is “In the mobile game Final Fantasy: War of the Visions, do players over the age of 32 have a higher in game rank than players under the age of 32?”
I selected 32 years old as that would place the respondent as being 8 years old or more when Final Fantasy Tactics came out on the Playstation. I feel the nostalgia would be much higher for players over 32. The question would include age 32 in the “under” population.
Step 2 – Data Collection Proposal
Data collection was done through a Google Form which required the two variables, age and in game rank. I also asked where they heard about the survey so I can publish the results. The google form I created is located at https://forms.gle/kZypeoMrp3dMy5kC9
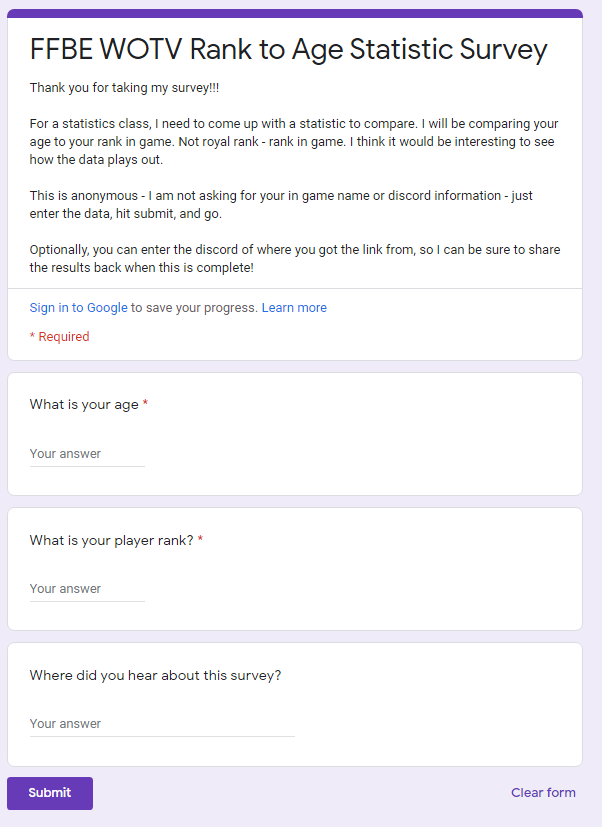
A copy of the form wis displayed to the right.
I distributed the survey through the chat application. Discord. I am a leader in the top global guild in the game and hoped my name and position recognition would get more responses. There are 193 members in our Discord server, https://discord.gg/Visipoor
I felt there was a possibility of multiple types of bias during data collection. Nonresponse bias was my initial concern, as many people asked would not fill out the survey. The sampling bias would be only surveying the population that plays the game and is active in Discord communities. I do not feel there was any response bias with this survey, as it was asking for numerical data.
Step 3 – Data Collection
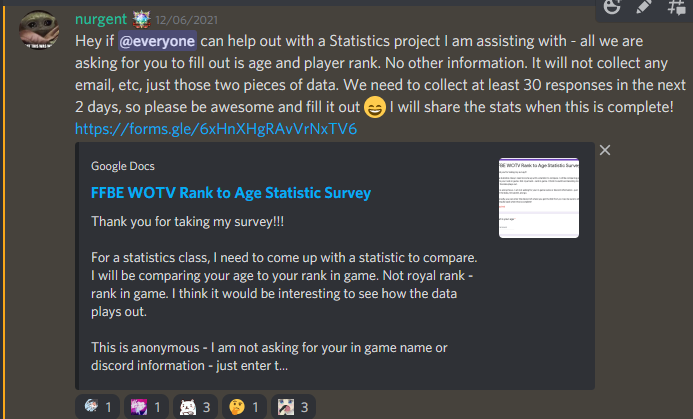
I posted a message to everyone in the discord server for my guild hoping to get enough responses before spreading out to further discord servers. I made it show as assisting with – not just my own, in hoping to get more respondents as well.
I posted the same message in another active Discord, Mysidia Gaming, hoping for more messages. This discord has a lot of lower ranked guilds, so I was hoping for a better spread of messages.
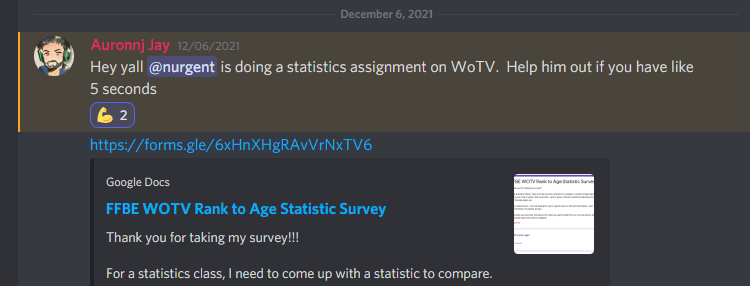
I was thankful that one of the top content creators, Auronnj Jay, posted a message on his discord server directing people to help me out with the survey. I was able to get 30 responses within an hour of posting, ending at 45 responses. This helped with the smpling bias, as a wide range of players follow content creators and join their communities, not just high level players.
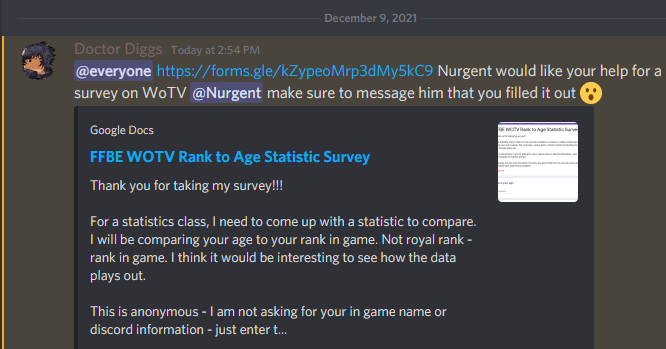
As you can see in my initial request, I ended up having the number wrong while completing my project and reviewing, so I had to reach out for additional help. Two more content creators came to my rescue, and jumped the individual populations above the minimum required values!
Step 4 – Hypothesis Test
Population 1 (p1) | Players with Age > 32 |
Population 2 (p1) | Players with Age<= 32 |
Mean Value μ | Mean Player Rank |
Null Hypothesis (H0) | μ1 - μ2 = 0 |
Alternative Hypothesis (HA) | μ1 - μ2 > 0 |
Checking the hypothesis for the difference of two means, the following conditions need to be checked:
Condition | Pass/Fail |
Samples must be Independent | Pass – each player’s rank is independent of each other |
Populations from which the samples are drawn are normally distributed, or the sample sizes are large (n1 >= 30, n2 >= 30) | Pass – there are more than 30 samples in each population |
Each sample is a simple random sample with sample size no more than 5% of the population size | Pass – it is all random sampling. |
I separated the data into the two populations, and used the two-sample T hypothesis test with data in Statcrunch. The results are as follows:
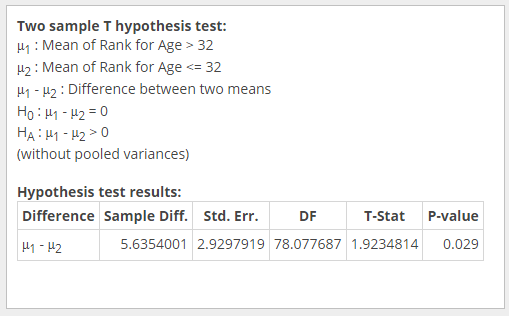
The p value is 0.029, and we are testing the hypothesis using α = 0.05. The p value is less than the a value, so we will reject the null hypothesis.
There is sufficient evidence at the α=0.05 level to conclude that the average player rank of players over the age of 32 have a higher player rank than players under the age of 32.
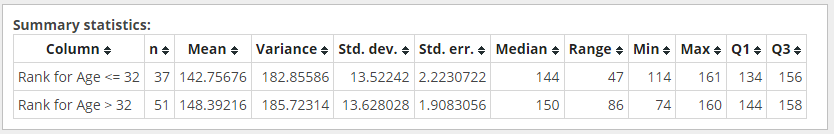
I do not believe any errors have been made, but potentially a Type I error could have been made. Below are the column summary statistics for each sample. The median age and mean age are much higher for the players with Age greater than 32
While graphing a boxplot, you can see there are outliers in the data for Rank for Age >32
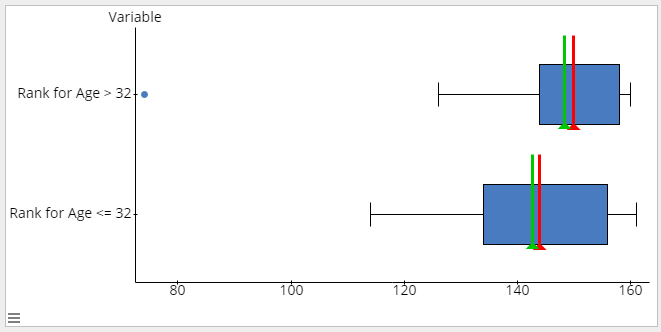
Removing that outlier would bring the mean higher with a lower the standard deviation. This visual evidence supports believing there have not been any errors made.
Step 5 – Confidence Interval
Below is the output from StatCrunch of a two sample T confidence interval for the dataset.
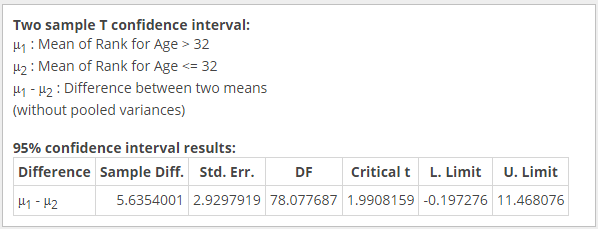
We are 95% confident that the mean rank of players over the age of 32 is between -0.197 and 11.468 more than the average rank of players 32 years old or under.
Step 6 – Reflection.
During my research, I have found things that I would have done differently had I started the project over. These items would be broadening the research and data as outlined below. I have had people reach out asking for additional demographic data, such as country, time zone, and other factors.
I would have added additional non-required questions to the survey so that I could obtain that data and report back to the overall WOTV community. I also would have started the survey much earlier than I did. I would have also reached out to more discord servers of different communities, as the WOTV community is a global community. There is a heavy English speaking southeast Asian population in the game. I was confident I would get the minimum responses but would much rather have had a larger sample size to report on. This would have given me more accurate data. Broadening this question would be difficult as the specifics of the question would just shift the age of the two populations.
Aside from demographics, I feel that also asking of what the royal rank of the players. This is an indication of money spent. It would be interesting to see what the rank compared to paying vs nonpaying players, and how big of a difference it really is. That is an answer that the community would love to see.
I have enjoyed both projects that I have worked on in this class. When the projects are assigned, I try to get a hold on what I must do. Completing the homework assignments filled in the questions and gaps in the projects. If I were to do the homework and readings before the projects, rather than during or after, I feel that the project would be much different from the start. I feel there would possibly be bias from problems in the assignments, taking examples and using them as research questions. With these, we were able to take a guess on what would work and see if it fits.
The homework assignments allowed us to see individual steps of the statistical process. The projects brought it all together so you could see the complete statistical process with one data set, not in pieces. This helped complete the overall understanding. The homework assignments are great for trying to get understanding of the concepts and prepare for the tests. I feel that the projects prepare you for implementing statistics in your career, or possibly fuel your desire to start a career in statistics.
My first project would have changed as I would have targeted data to get results that modeled what we saw, not the outliers that I obtained. I am glad that I picked a statistics topic that I am extremely interested in. It made me excited to complete the project and share the results with everyone!